Data + intelligence services
Interactive dashboards, data visualization, machine learning and workflow automation. Turning raw data into decisions your team can act on.
Integrations and Platforms


What we do
Dashboards, analytics and machine learning, from raw data to clear action
Little Tiger builds data products that drive decisions: interactive dashboards, real-time visualizations, predictive models and automated reporting pipelines. We take the data your business already generates and turn it into clear, useful intelligence that your team actually uses.
Our data services cover the full pipeline: data ingestion and transformation, warehouse design, interactive dashboard development, machine learning model deployment and automated alerting. Every product is built for the people who need it, as we delivered for Kindling's analytics platform and Sundae's operational dashboards.
Why invest in data + intelligence
Raw data is not insight
You're generating data every day: transactions, user behaviour, operational metrics. Without the right tools to surface patterns and anomalies, it's noise stored in a database.
Dashboards should drive action
A dashboard that nobody checks is a wasted investment. We build dashboards around the decisions your team makes daily, surfacing the right metrics at the right time to the right people.
Manual reporting wastes talent
Your analysts shouldn't spend Mondays assembling spreadsheets. Automated reporting pipelines deliver fresh data on schedule, freeing your team to interpret and act instead of compile.
Patterns hide in plain sight
Machine learning finds correlations and anomalies that human analysis misses. Predictive models surface risks and opportunities before they become obvious, giving you a decision advantage.
Decisions need real-time context
Last week's report can't inform today's pricing change. Real-time dashboards and live data feeds give your team the current context they need to make confident decisions.
Data quality determines outcome quality
Models trained on dirty data produce unreliable predictions. Dashboards fed inconsistent metrics erode trust. Data quality engineering is the unglamorous work that makes everything else possible.
50M+
Data points processed across client dashboards
<3s
Dashboard load times with complex aggregations
85%
Reduction in manual reporting time for clients
24/7
Automated monitoring and alerting coverage
Interactive Dashboards
Decision-ready dashboards your team will actually use
We build interactive dashboards designed around the decisions your team makes. Filterable views, drill-down capabilities, real-time updates and mobile-responsive layouts that surface the right metrics at the right time.
Every dashboard is built with your team's workflow in mind. Role-based views, saved filters, export capabilities and scheduled email digests ensure data reaches the people who need it, in the format they prefer.
Data Visualization
Visual clarity for complex datasets
We design and build custom data visualizations using D3.js, Plotly and React charting libraries: interactive charts, geospatial maps, network graphs and time-series displays that make complex data intuitive and explorable.
Off-the-shelf charts rarely fit non-standard data. Custom visualizations are purpose-built for your specific dataset, your audience's literacy level and the decisions they need to make.
Machine Learning + Predictive Analytics
Models that surface patterns human analysis misses
We build and deploy machine learning models for classification, forecasting, anomaly detection and recommendation using Python, scikit-learn and TensorFlow. Every model is trained on your data, validated against real outcomes and deployed with monitoring.
We focus on practical ML that solves business problems: demand forecasting, churn prediction, content recommendations and automated categorisation. Production models with measurable impact.
Workflow Automation
Automate the reporting your team does manually today
We build automated reporting and alerting workflows that eliminate manual data assembly. Scheduled report generation, threshold-based alerts, anomaly notifications and automated data quality checks, delivered to Slack, email or your dashboard.
If your team spends hours compiling weekly reports or monitoring metrics manually, we automate the pipeline so they can focus on analysis and action instead.
Data pipelines built for reliability
Every dashboard and model depends on clean, timely data. We build data pipelines with extraction, transformation and loading (ETL), including schema validation, deduplication, incremental loading and automated quality checks.
Pipelines are monitored, alerting on failures, data drift and quality degradation. Your intelligence products stay accurate because the foundation is engineered for reliability.
Selected work
Data + intelligence projects
Kindling Data Center
Applied AI / Data Science / Dashboards
2025
Kindling Data Center
Applied AI / Data Science / Dashboards
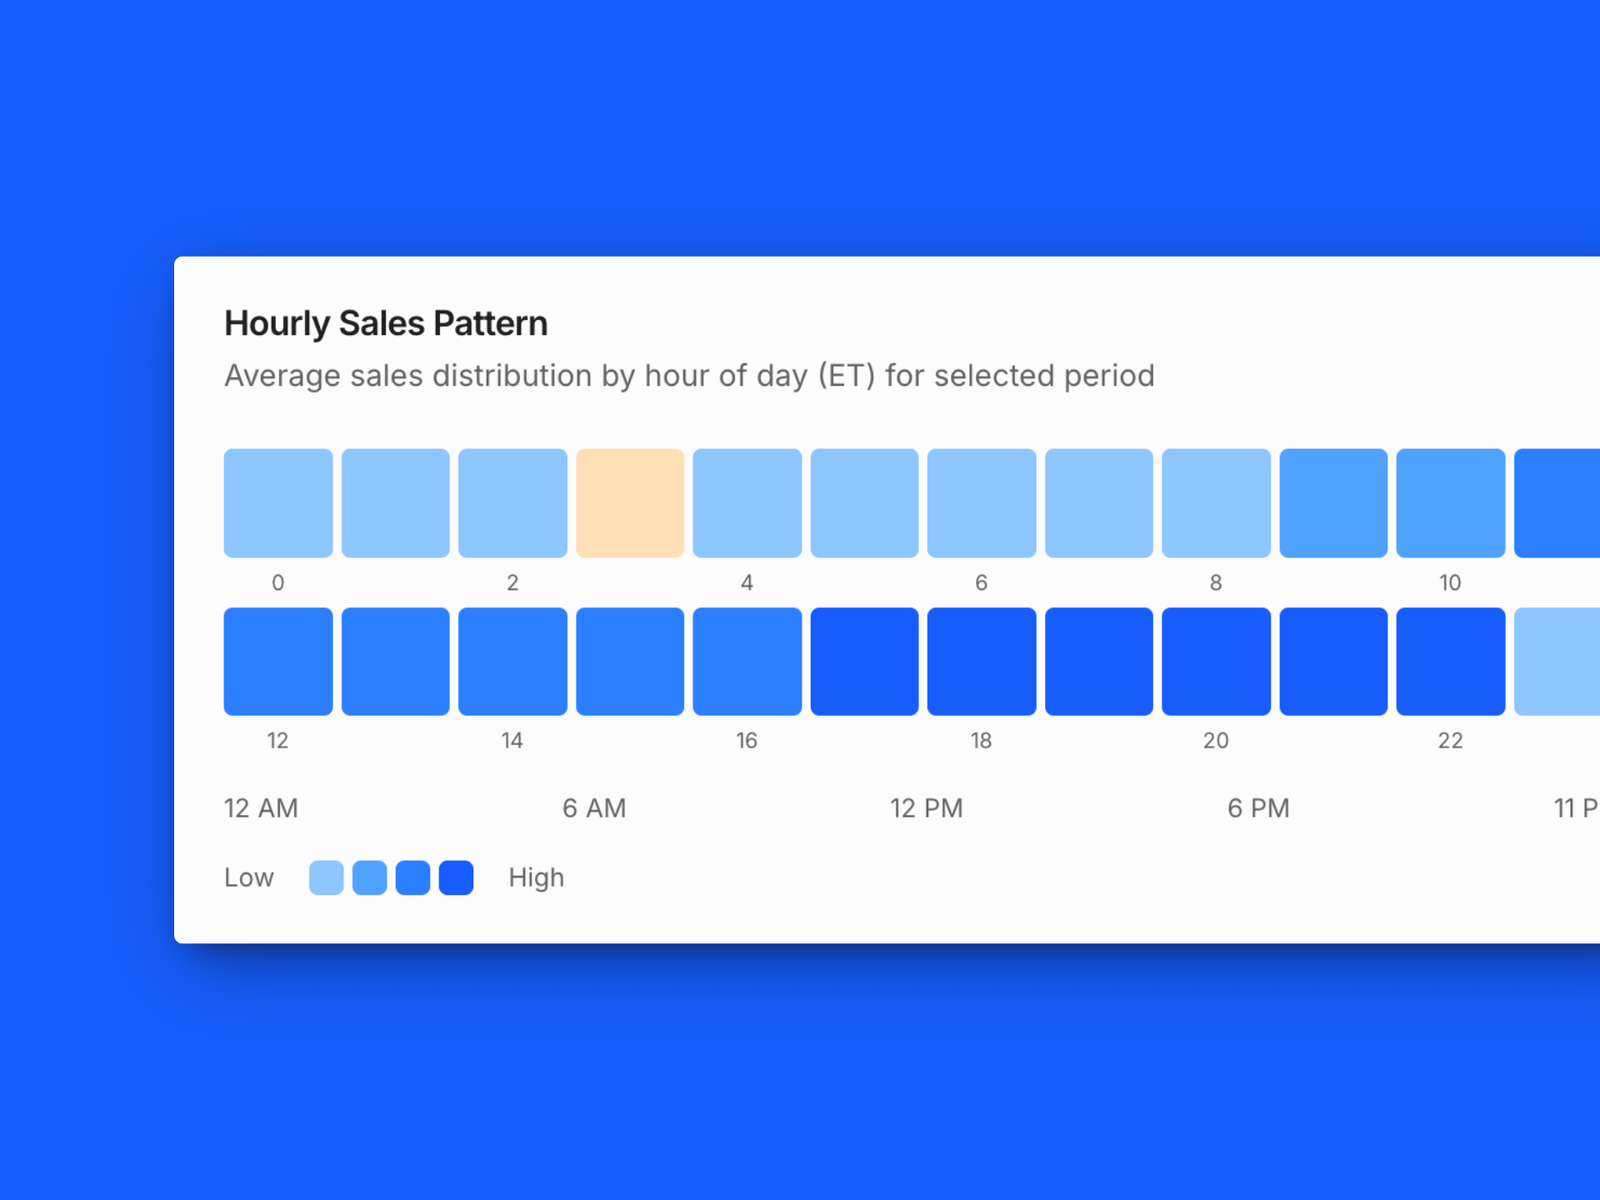
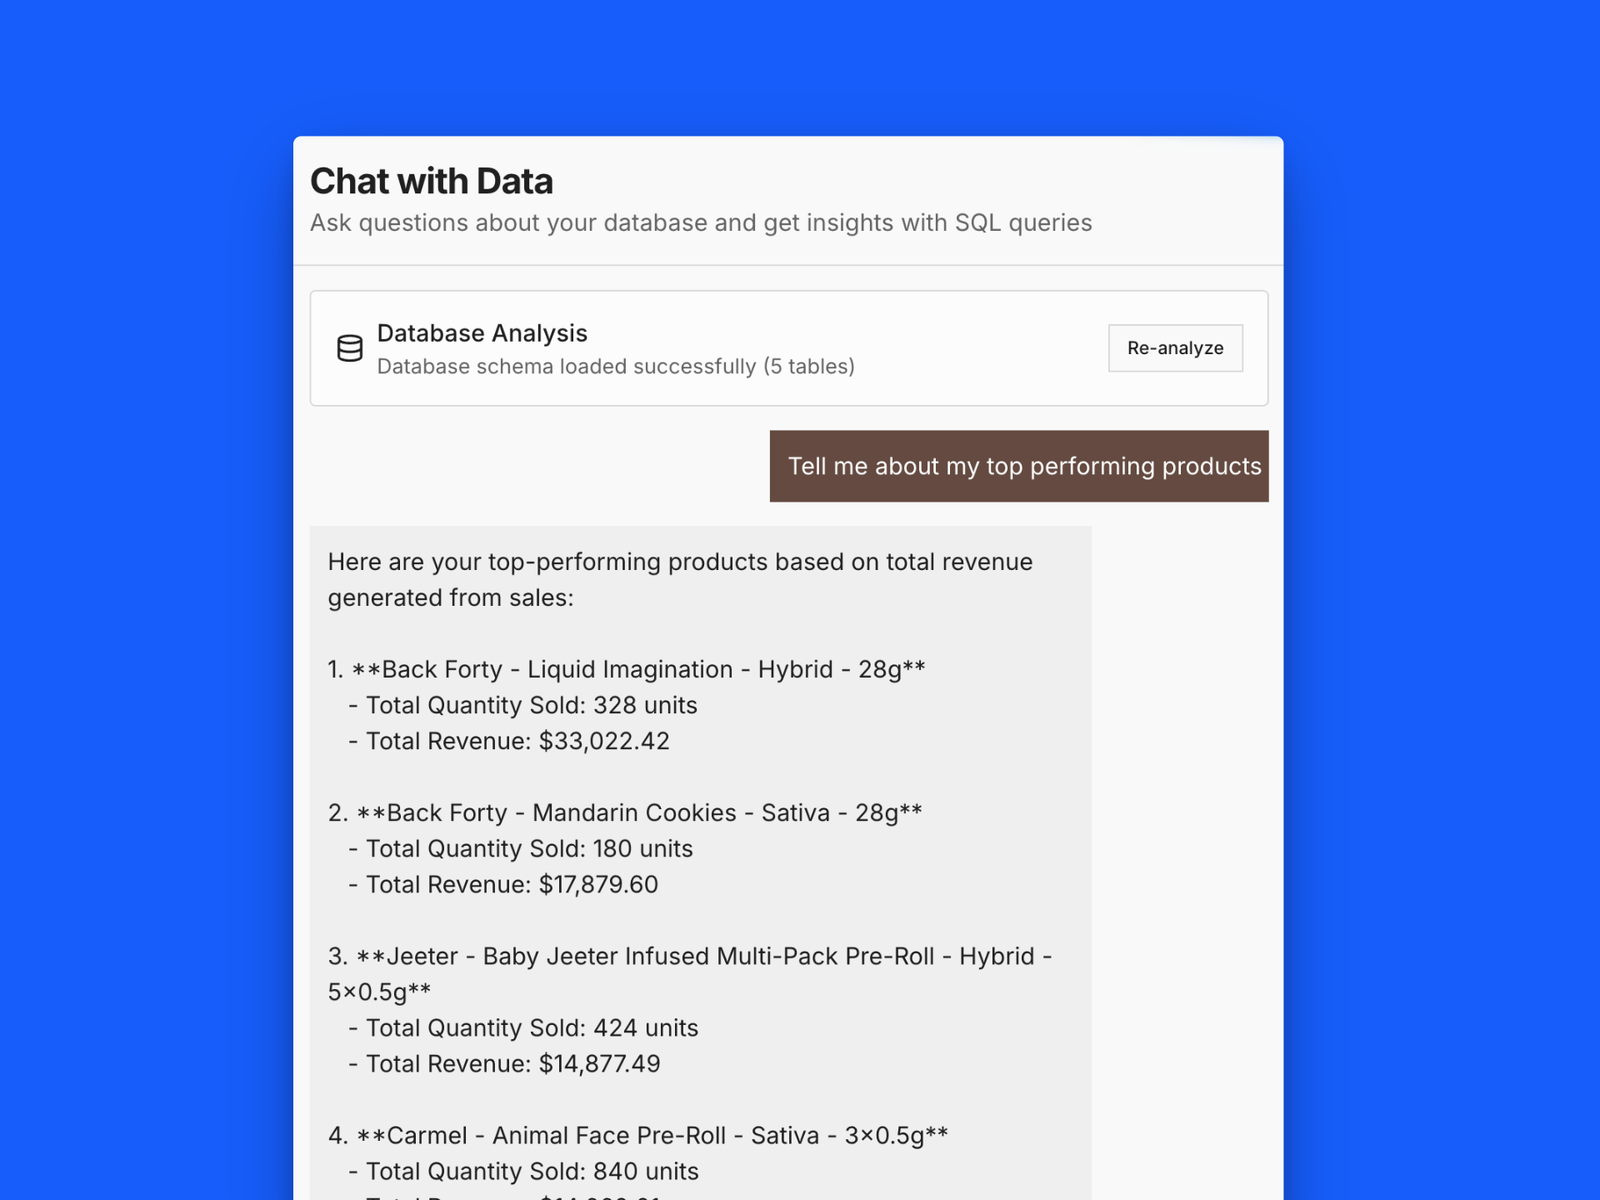
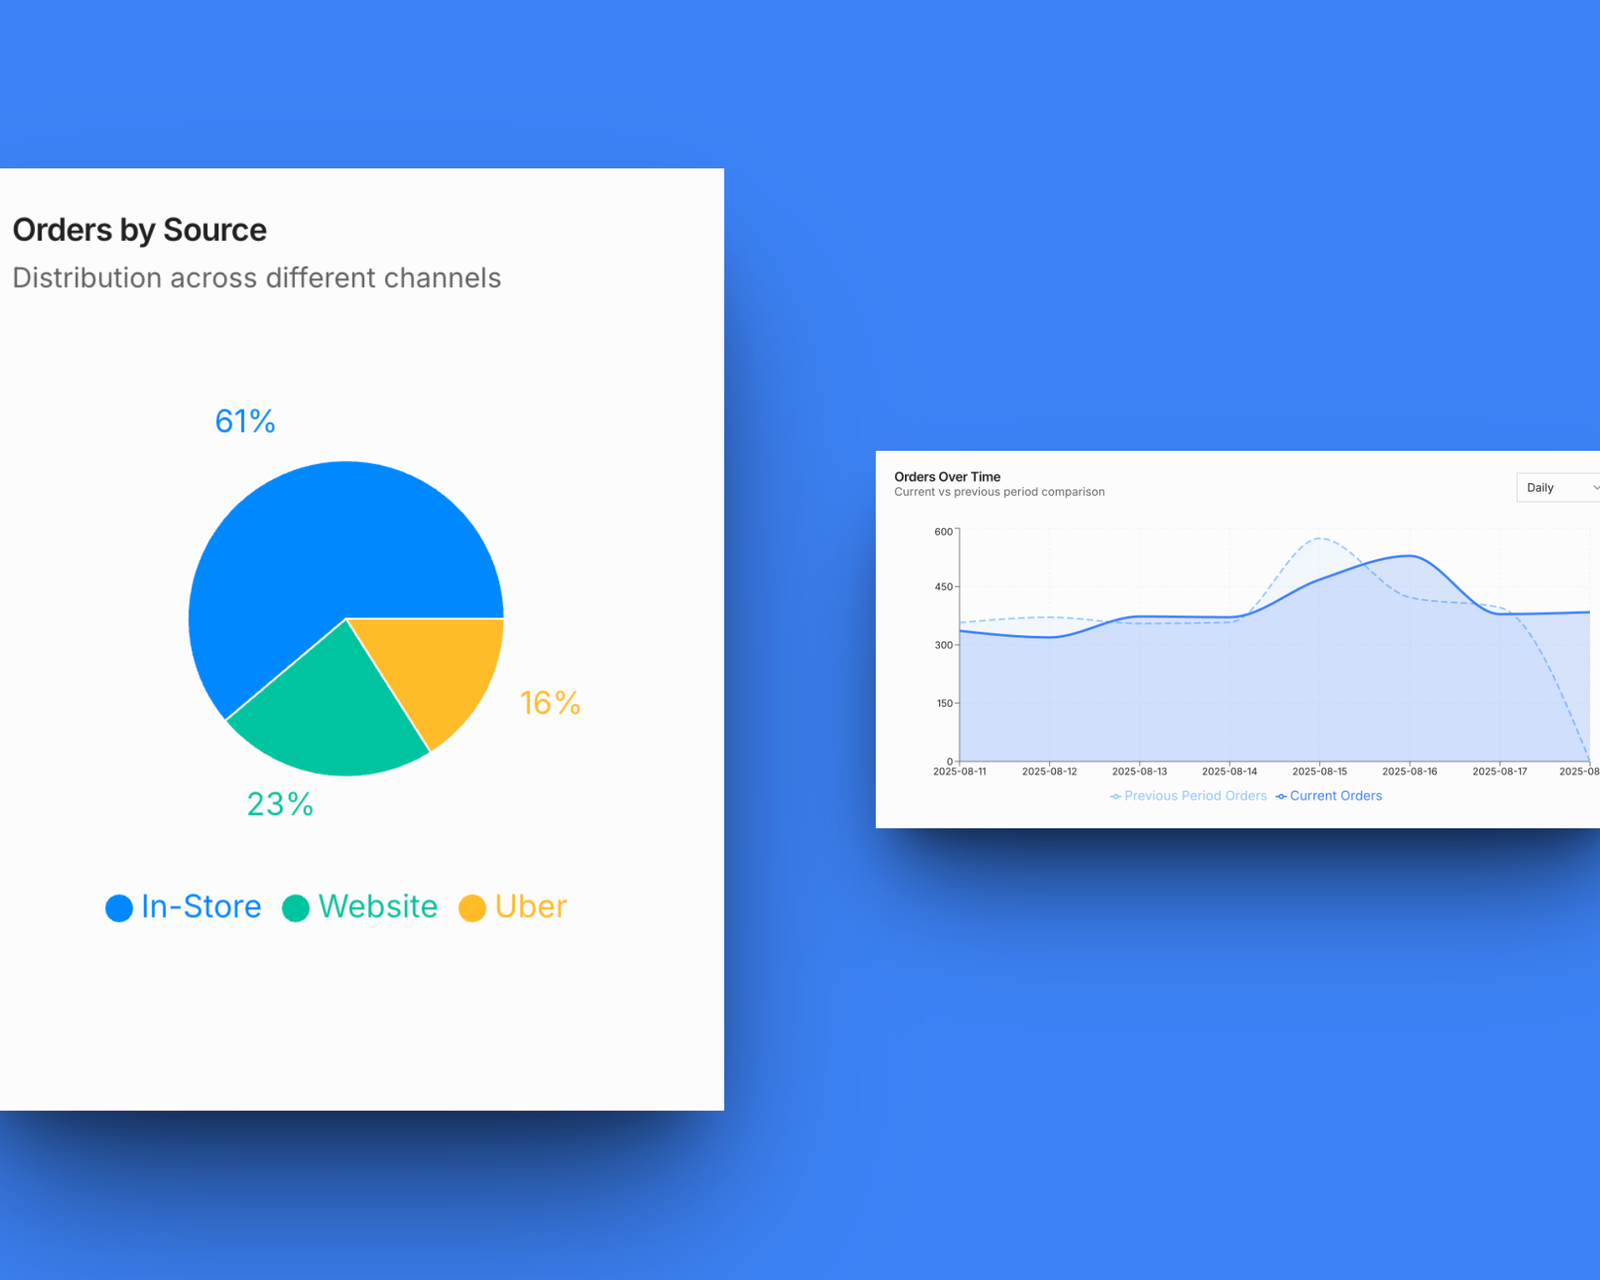
Custom analytics dashboard for end-to-end POS data analysis. Real-time reporting, trend detection and AI-powered conversational queries.
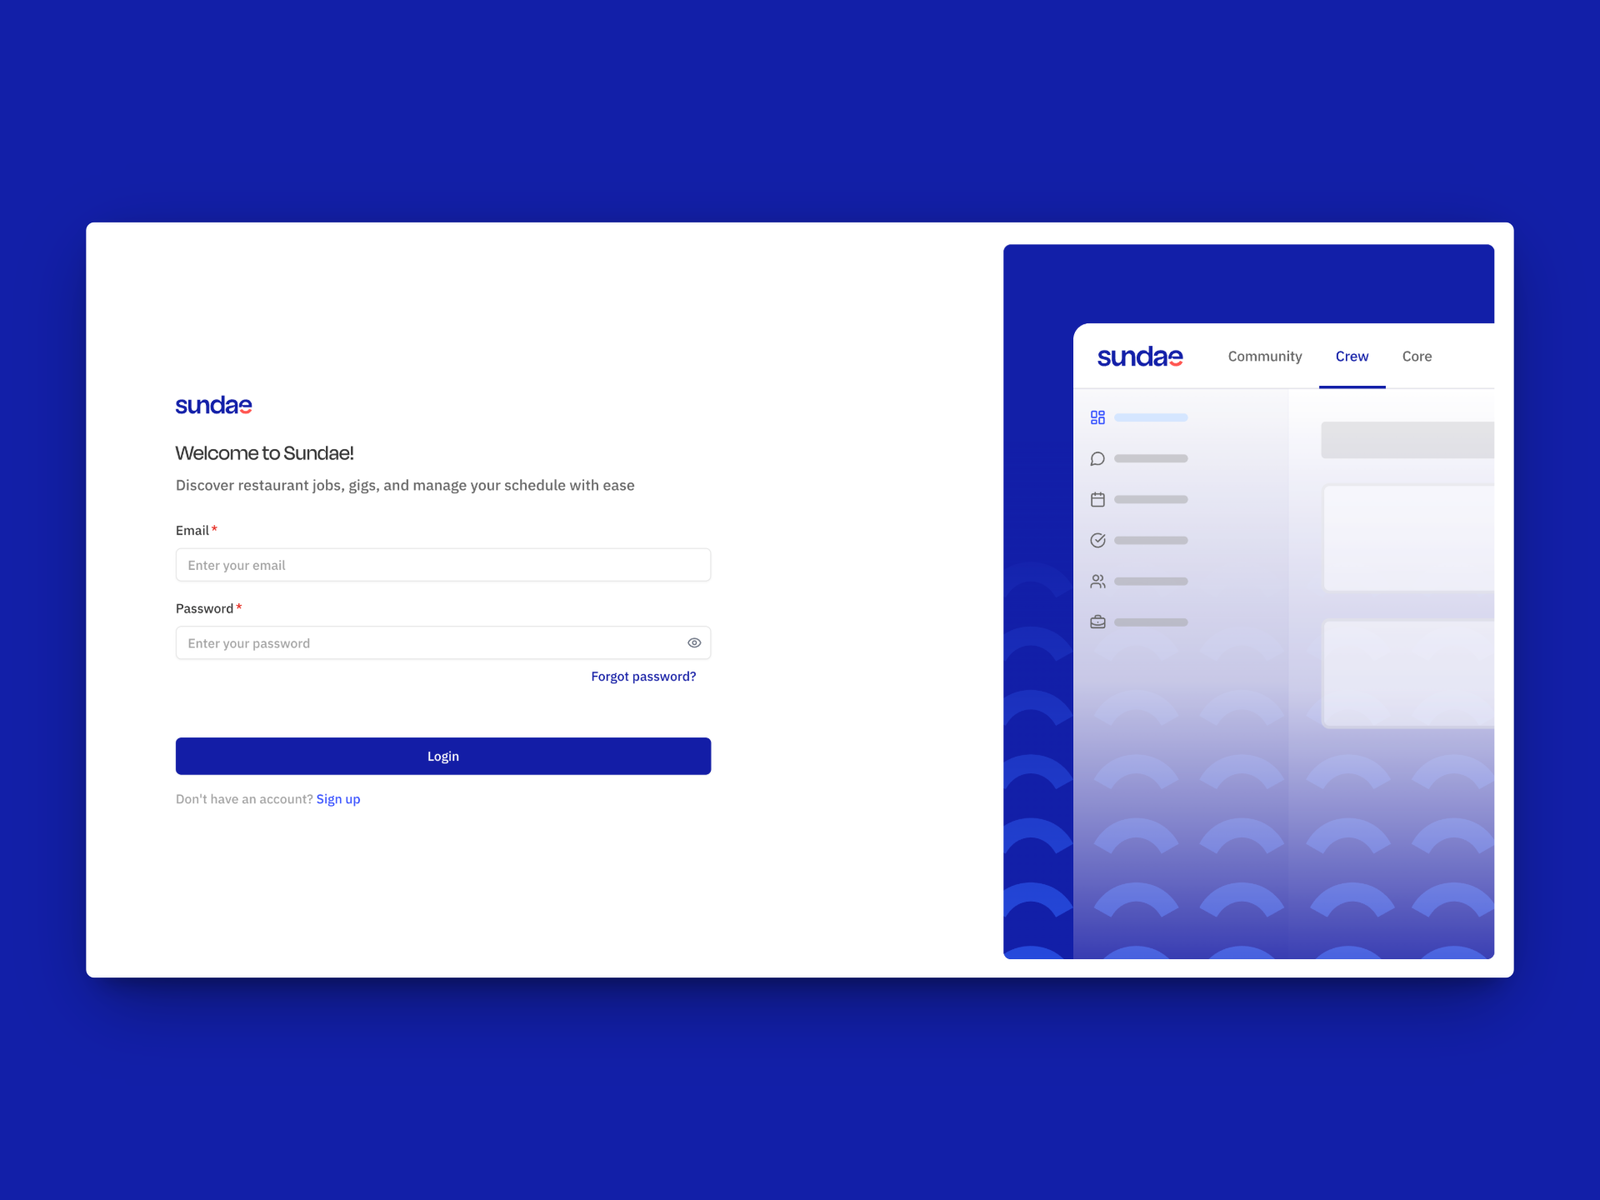
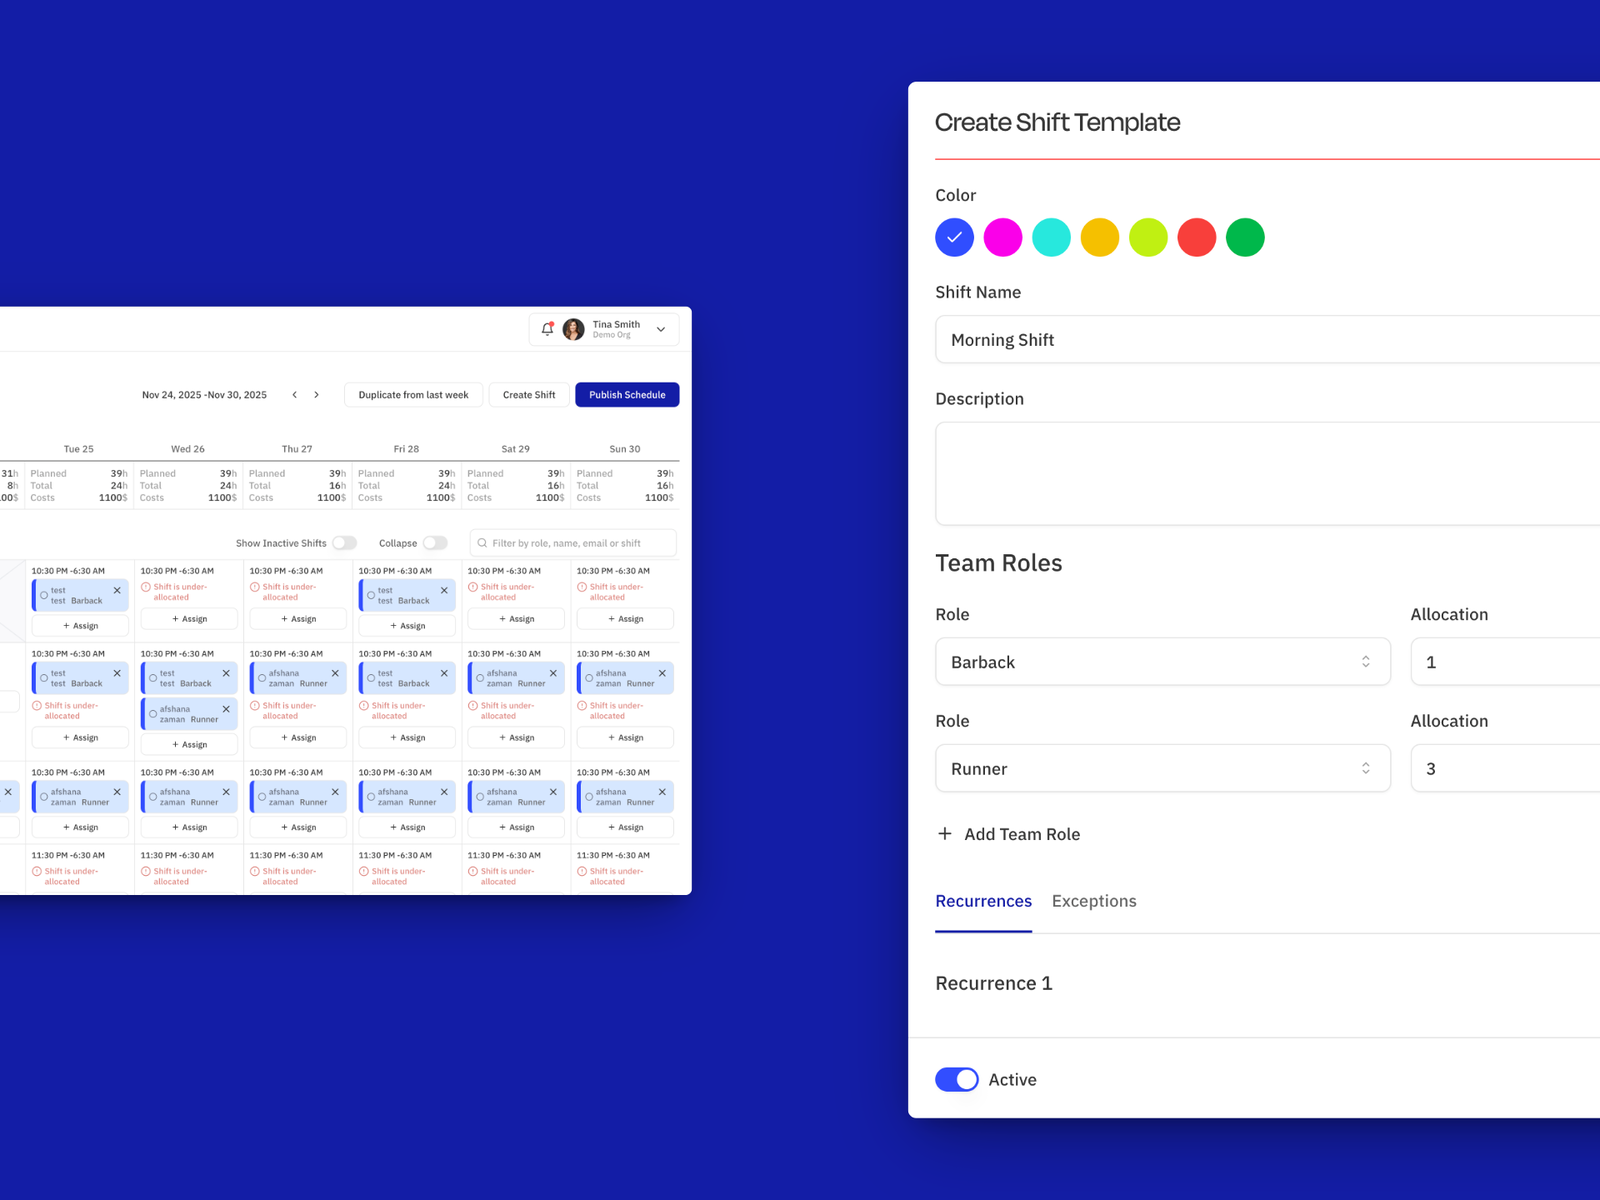
Sundae
HR Software / Operational Dashboards
2025
Sundae
HR Software / Operational Dashboards
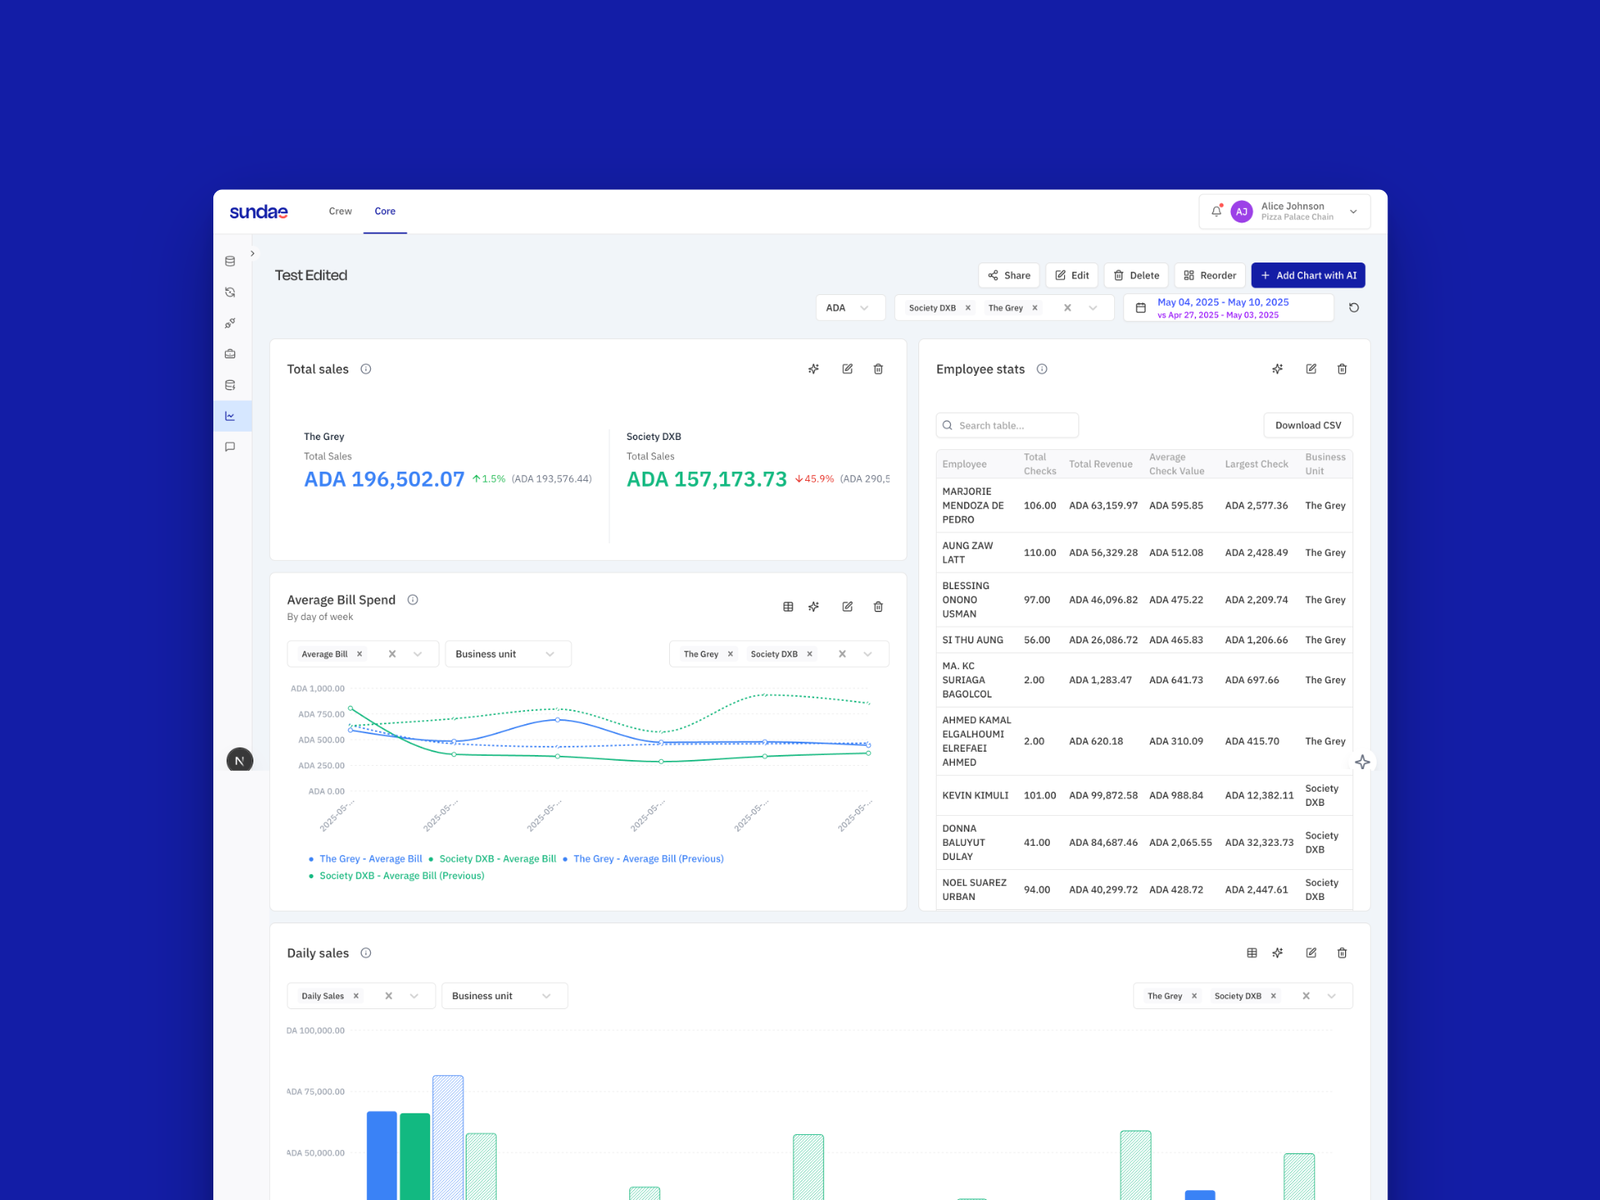
Operational dashboards connecting POS data, employee performance and shift scheduling for food + beverage operations.
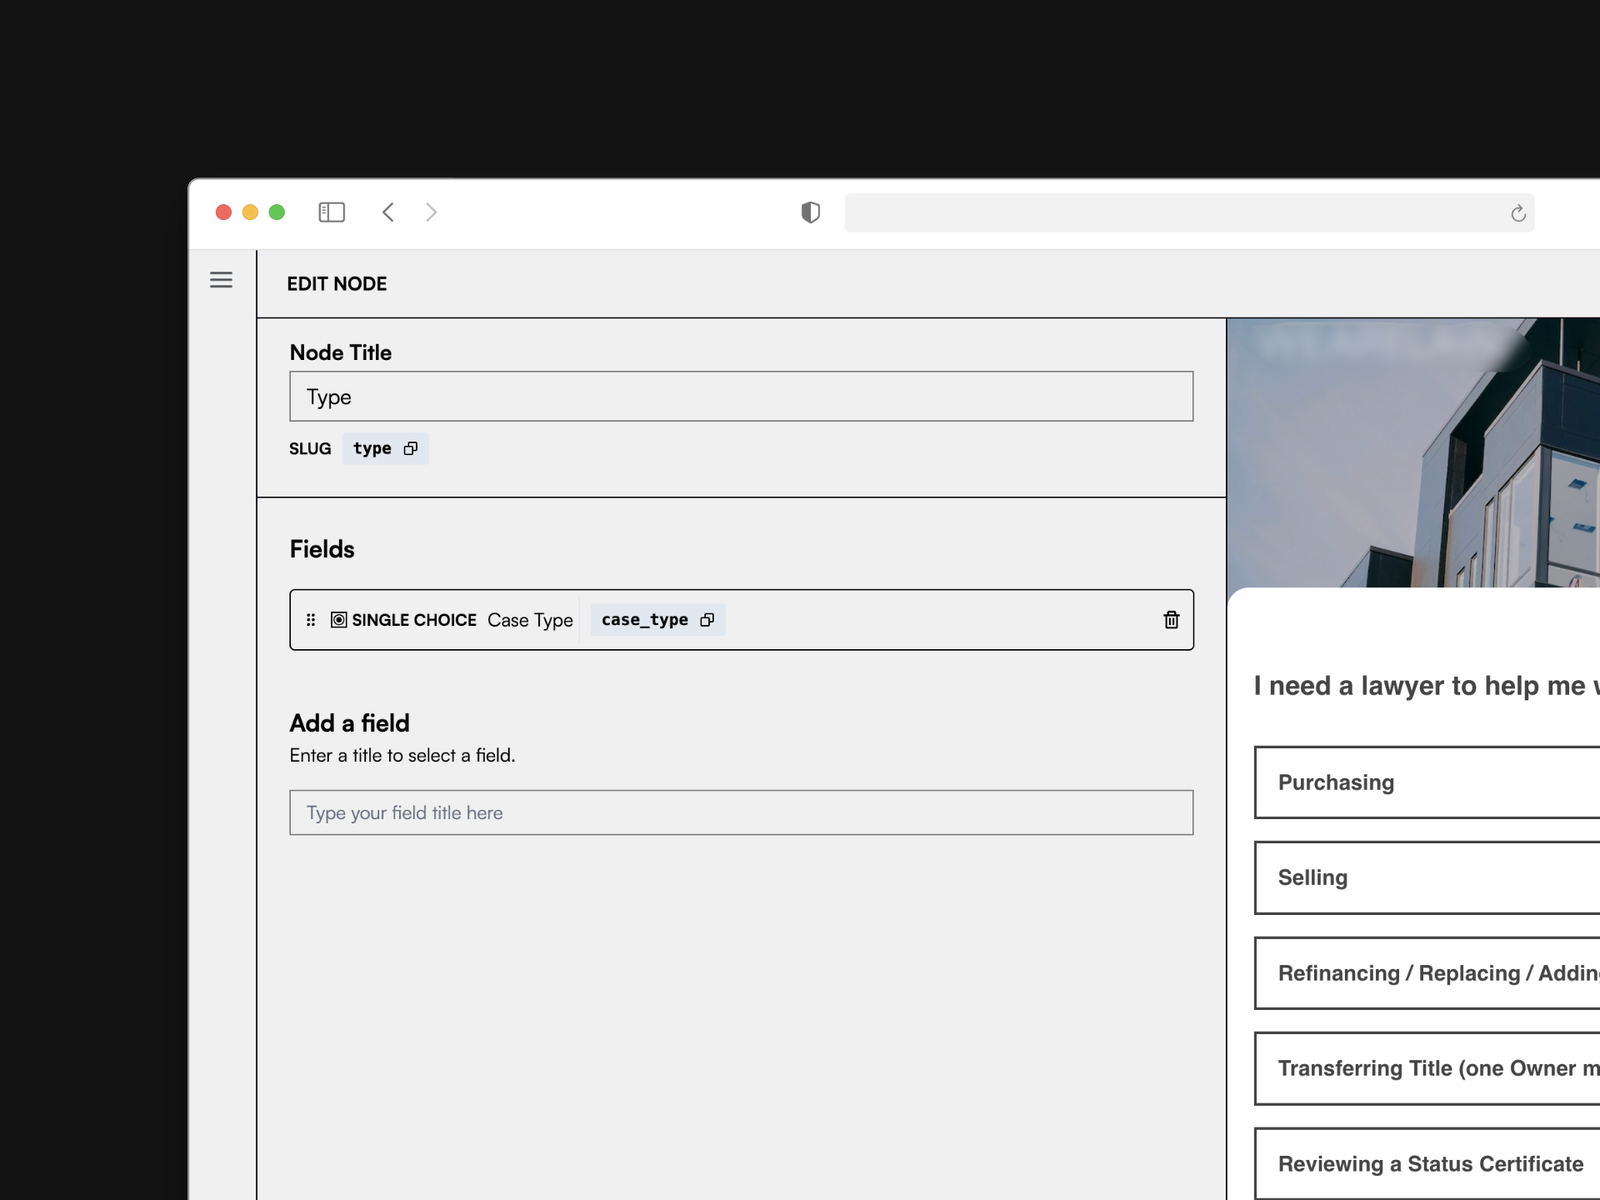
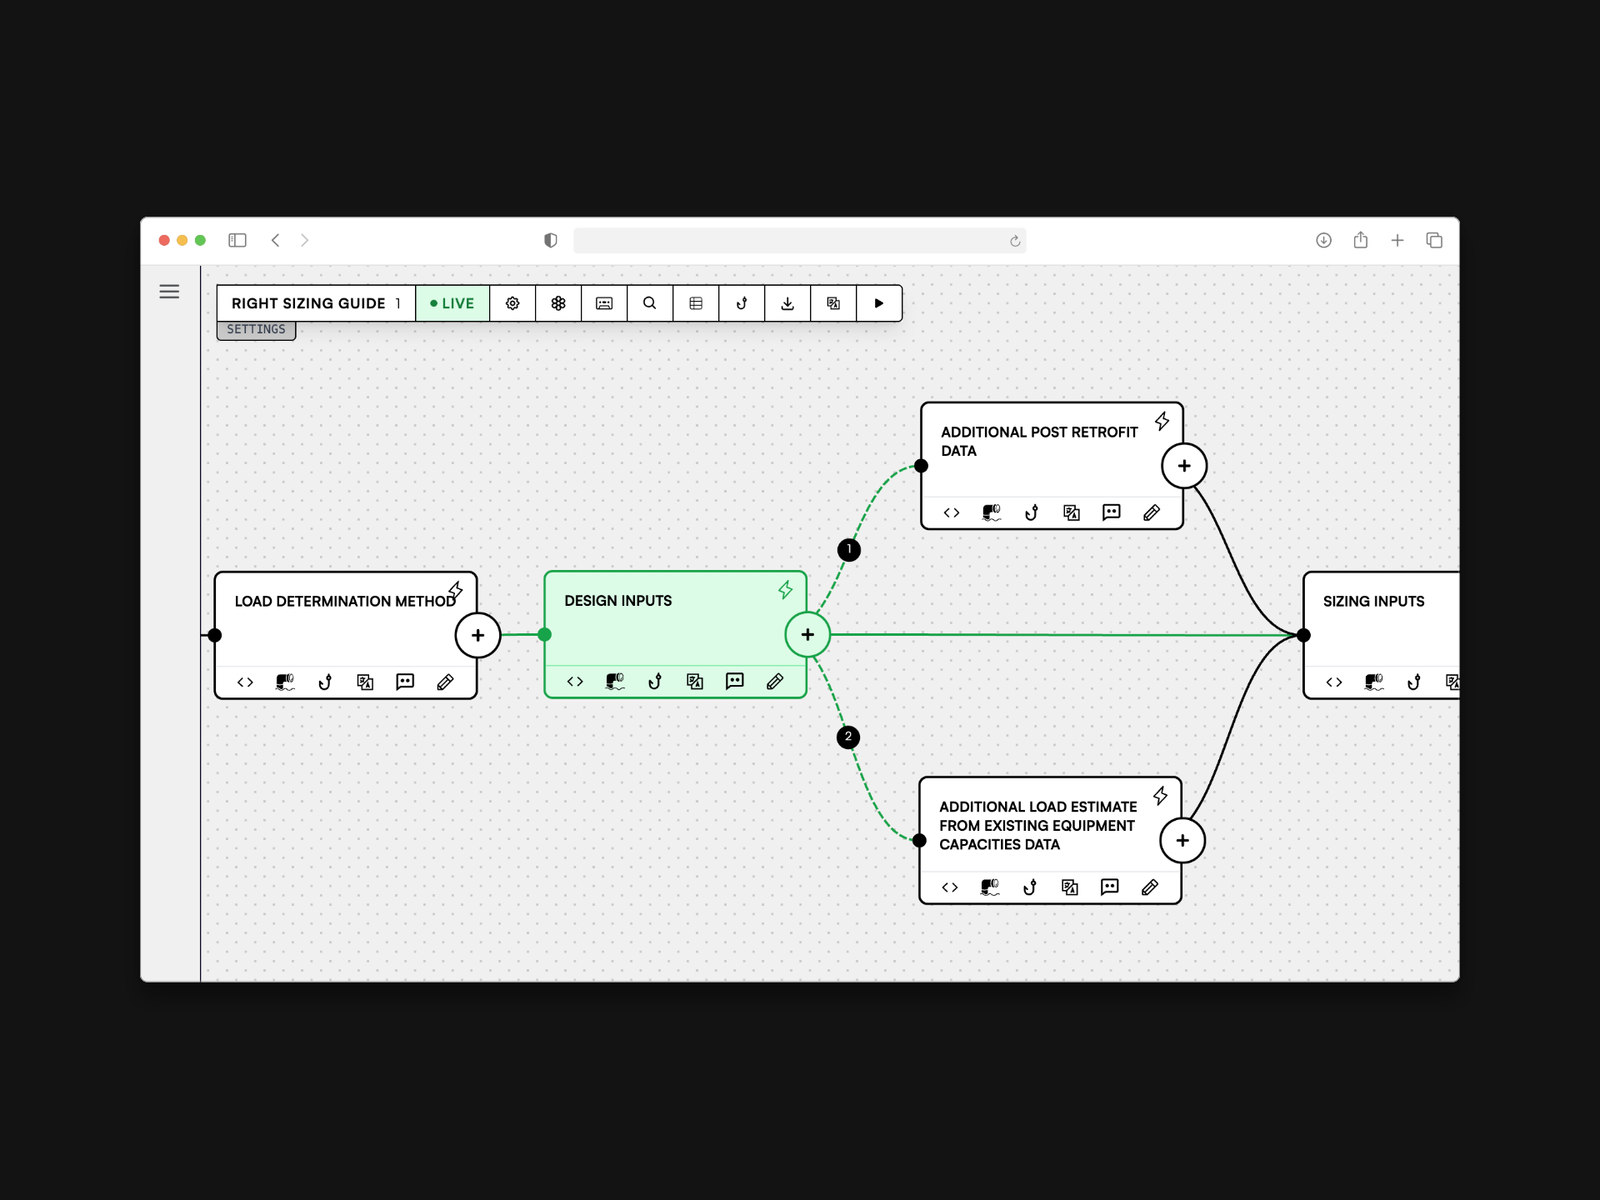
Manyways
Product Development / Real-time Monitoring
2025
Manyways
Product Development / Real-time Monitoring
Real-time monitoring dashboards for a graph execution platform. Pipeline health, execution metrics and performance analysis.
How we work
Our approach to data + intelligence
Discovery + data audit
We start by understanding your decisions: what questions you need answered, what data you have and where the gaps are. A data audit maps sources, quality issues and integration points before any development begins.
Pipeline + schema design
We design the data pipeline architecture: extraction sources, transformation logic, storage schema and refresh cadence. Every decision is documented and tuned for your query patterns.
Dashboard prototyping
We prototype dashboards with real data early. Your team interacts with actual metrics, validates that the right numbers are surfaced and iterates on layout and filtering before we polish.
Model training + validation
For ML projects, we train models on historical data, validate against holdout sets and measure performance against business-relevant metrics. Models ship when they demonstrably improve decisions.
Deployment + monitoring
Dashboards and models are deployed with monitoring, alerting and automated data quality checks. We train your team on interpretation and maintenance, then provide ongoing support.
Technologies we work with
Frequently asked questions
We build custom interactive dashboards using React and D3.js: operational dashboards, executive summaries, real-time monitoring panels and analytical tools. Every dashboard is purpose-built for your team's decisions.
Not necessarily. If you already have a warehouse, we build on top of it. If you don't, we can set one up or work directly with your transactional databases for simpler use cases. We recommend the architecture that fits your scale and budget.
We focus on practical ML: demand forecasting, churn prediction, anomaly detection, content recommendations, automated categorisation and natural language processing. We build models that ship to production and measurably improve business outcomes.
Data quality is an engineering problem. We build automated validation, deduplication, schema enforcement and data quality monitoring into every pipeline. Issues are caught and flagged before they reach your dashboards or models.
Yes. We integrate with existing BI tools (Metabase, Looker, Tableau) where they fit and build custom dashboards where off-the-shelf tools fall short. We also connect to existing data warehouses, ETL pipelines and monitoring systems.
A dashboard project typically takes 4–8 weeks. ML model development takes 6–12 weeks including training, validation and deployment. Full data platform builds with pipelines, warehousing and dashboards take 10–16 weeks. We deliver incrementally throughout.
Yes. Dashboards need maintenance, models need retraining and pipelines need monitoring. We offer retainer-based support covering data quality monitoring, model performance tracking, dashboard updates and new feature development.
Ready to turn your data into decisions?
Tell us about your data challenges. We'll audit what you have, recommend the right approach and show you what's possible.
Services and Capabilities
Explore our other services